

Too much information, and tasks can spiral out of control, meetings can cascade down rabbit holes and deadlines can recede into the distance.
Too little information, and team members can start to feel isolated, decisions need to be revisited and quality becomes an issue.
WhatsApp, Messages, Slack, Email, Post-its? Memos, Reports, Meeting Minutes all contribute to either being overloaded, or feeling isolated
The challenge for CIOs and Portfolio Managers isn’t accessing information—it’s controlling its flow.
The Problem
Project management literature is clear: without coherent information flow, even the best-resourced projects stumble.
“In a Manchester IT plant installation, lack of synchronized updates led to two weeks of delays—until the team introduced a simple Excel-based information flow model that cut slowdowns from 40% to 5%“
Effective Information Flow In Project Management: Lessons From An Information Technology Project, Azeez Olatubosun Shodeinde, University Of Law Business School, Manchester, United Kingdom
Chris Hendrickson and Tung Au warn us of the dangers of expecting perfect information:
“Living with some uncertainty is an inescapable situation, and a prudent manager should have an understanding of the uncertainty in different types of information and the possibility of drawing misleading conclusions.“
Project Management for Construction by Chris Hendrickson and Tung Au

Image by Gerard Altmann
How can we help?
One of the most interesting lines of inquiry is relating information flow to flow in the physical world — for example, finding parallels between the two types of flow in the subject area of fluid mechanics.
Engineers are able to measure and predict whether the flow of a fluid will be stable and smooth or turbulent and chaotic.
Could we therefore treat information flow in the same way?
Advanced research is ongoing into the properties of information flow itself.
Could we learn to predict when turbulent information flow could lead to project and program disaster?
Early indications are that we can.
Researchers are making strong analogies between fluid turbulence and information instability, suggesting that project or system disasters may be anticipated by analysing flows for early signs of chaos — just as in engineering.
The use of machine learning and physics-informed frameworks is enabling experts to visualize and quantify the hidden properties of these “informational” flows.

Mechanical engineers talk about the laminar (smooth) or turbulent (chaotic) flow of a fluid. Osborne Reynolds gave us a number —shortened to Re — to predict when turbulence sets in for a fluid (back in 1883).
The Reynolds Number compares inertial forces (the tendency of the flow to keep moving/accelerating) with viscous forces (the tendency of the medium to resist and damp motion).
But what if we could do the same for project information?
What are the forces in play?
Inertial forces are the ones that drive turbulence, for example,
• Throughput / velocity: msgs/hour, tickets/day
• Volume / density: richness/complexity
• Scope / length-scale: audience reach, channels, meeting count
• Momentum: cascades, CC storms, viral threads
• Change acceleration: churn in priorities, design rethinks
Viscous forces are the ones that stabilise information flow, for example,
• Protocols & templates: agendas, decision logs, single source of truth
• Structure & hierarchy: ownership, approval rights
• Tooling friction: gates, limits, permissions
• Capacity buffers: cadenced updates, backlog grooming
• Quality gates: checklists, acceptance criteria
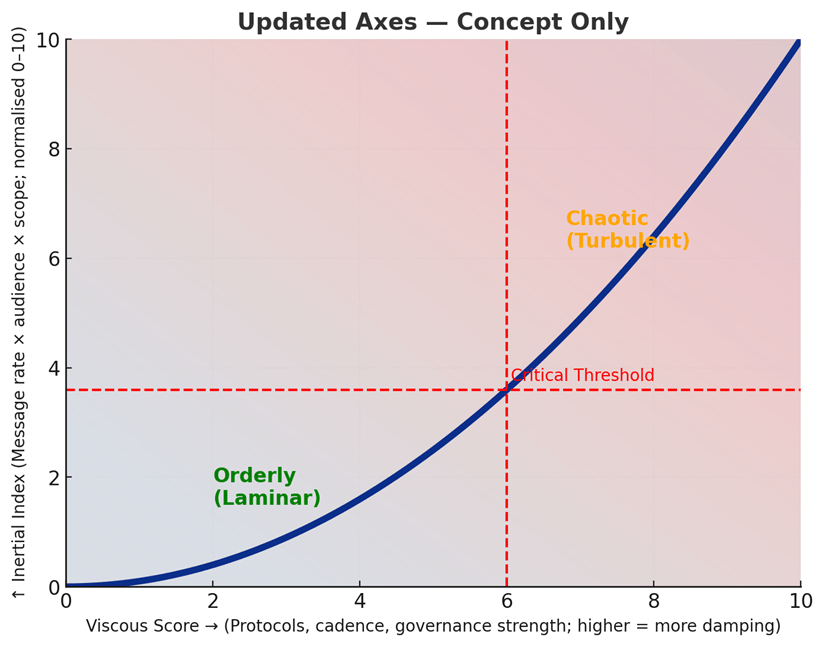
We can create a heuristic called the Information Reynolds Number (IRe) — a ratio of inertial forces (volume, speed, organizational momentum) to viscous forces (protocols, hierarchies, templates).
When we port this from fluid mechanics, for example, we find the following analogies,
Laminar flow (Re < ~2,000 in fluids)
In fluids: flows smoothly, predictable, low noise.
In projects: Communication is orderly, dependencies are clear, rework is rare.
In our model: IRe < 20 looks healthy and sustainable = “green zone”.
Transitional flow (Re ~2,000–4,000 in fluids)
In fluids: can tip either way: sometimes smooth, sometimes unstable.
In projects: Small issues can grow, communication load is noticeable, some turbulence appears.
In our model: IRe = 20–50 = “amber zone.” Manageable, but monitor trends.
Turbulent flow (Re > 4,000 in fluids)
In fluids: flow is chaotic, hard to control.
In projects: Overloaded channels, scope churn, missed deadlines.
In our model: IRe > 50 = “red zone.” Strong interventions needed.
The goal is to predict when information flow in project organizations shifts from smooth (laminar) to chaotic (turbulent), creating heightened risk of project failure.
Here are our thresholds for the normalised IRe number. (Because raw IRe values run into the thousands, we divide by 1,000 to keep numbers usable).
Laminar: <6 → Clear, predictable, low rework.
Transitional: 6–20 → Wobbly, some instability.
Turbulent: >20 → Overload, churn, confusion.
And we can develop a practical formula to work this out!
IRe = (Message Rate × Audience Reach × Change Scope) ÷ Viscous Score
• Message Rate = updates per day
• Audience Reach = number of people touched
• Change Scope = scale of systems affected (1–5)
• Viscous Score = governance strength (0.5–10)
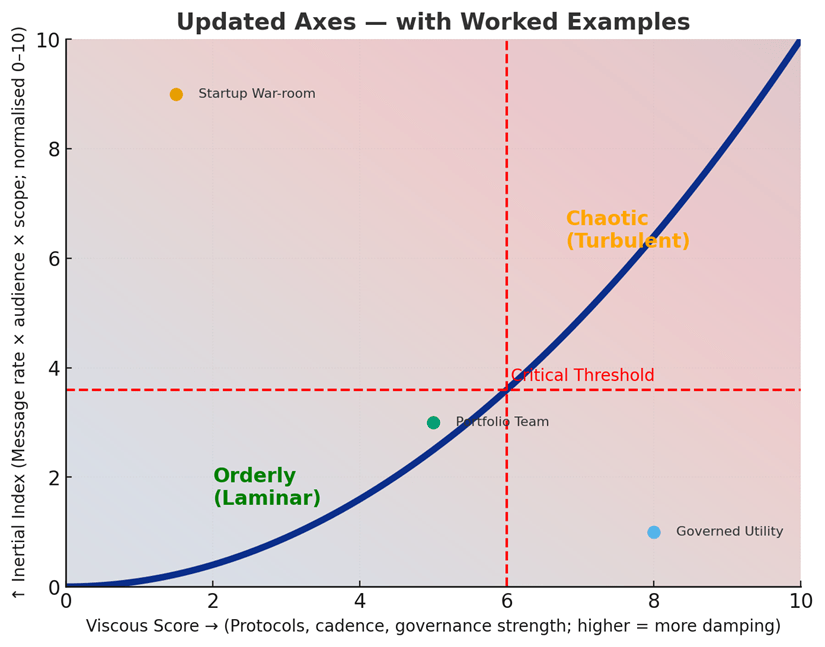
Below are some interesting worked examples,
Startup war-room
250 updates/day × 40 people × 5 systems ÷ 1.5 viscosity = 33,333 (normalised 33) → turbulent 🚨
This has high inertia and weak damping leading to turbulence.
By adding daily stand-ups and restricted information channels the viscosity improves giving us a new score ~5,000 (normalised 5) which leads us to an orderly (laminar) information flow.
Heavily governed utility
40 updates/day × 10 people × 2 systems ÷ 6 viscosity = 133 (normalised 0.13) → laminar ⚠️
This has strong damping but very low throughput, creating “information sludge.” Ever tried “herding cats” ?
By streamlining approvals and reducing redundant checkpoints the viscosity is eased, giving us a new score ~220 (normalised 0.22) which allows a healthier, but still orderly flow of information.
Healthy portfolio team
80 updates/day × 12 people × 2 systems ÷ 4 viscosity = 480 (normalised 0.48) → laminar ✅
This has balanced inertia and damping, resulting in steady, predictable flow.
If workload doubles, the new score rises to ~960 (normalised 0.96), which remains orderly but edges toward the amber watch-zone.
So as program and project managers, our targets are as follows,
Ideal range (0.1-6): Smooth flow. GREEN
Warning (6–20): Teams running hot — monitor and dampen noise. AMBER.
Danger (>20): Expect breakdowns unless corrective action is taken. RED.
Summary
We have then create a practical tool to help us manager information flow in our portfolios, programs and projects.
We have new tools and levers to use, based on a working model, that we can monitor easily over time.
Do we want to raise smart viscosity (good friction)? In which case we will create agendas, decision registers, owner-only channels, weekly cadence, WIP limits.
Or do we perhaps want to remove bad viscosity (wasteful friction)? In which case we will remove duplicative approvals, clarify unclear ownership, remove tool silos, and ditch unreadable templates.
Do we want to lower inertia (bad momentum)? In which case we would reduce the size of the targeted audience, summarize, batch updates, limit the number of meeting attendees, use dashboards instead of reply-all.
Or do we want to raise inertia (good momentum) on purpose? What if there is a crisis or an incident? Do we need everyone to pull together quickly?
So stop using the firehose, and control the flow…

Join the conversation — how do you Square the Triangle?